What is a critical point?
A critical point of a function f is a number c in the domain of f where the derivative is either zero or does not exist:
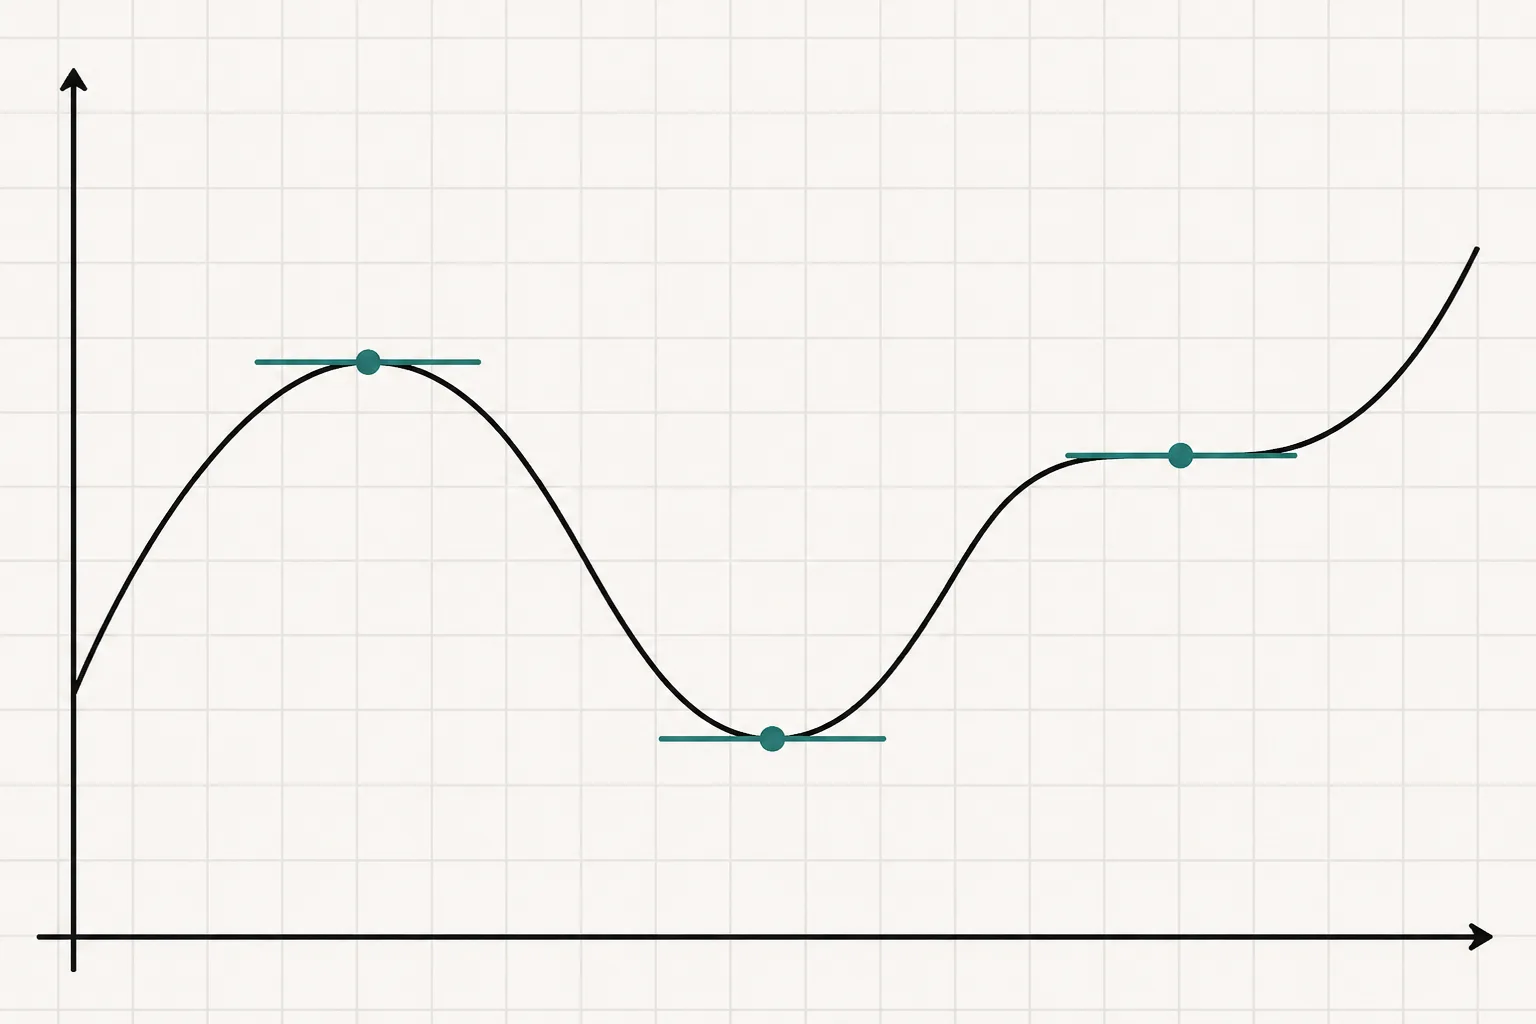
Where f′(c) = 0, the tangent line is horizontal. Where f′(c) does not exist, the graph has a sharp corner, a cusp or a vertical tangent. Both kinds matter, because a function can reach a maximum or minimum at either.
The reason critical points are so useful is Fermat's theorem: if f has a local maximum or local minimum at an interior point c, then c is a critical point. So to find all the peaks and valleys of a graph, you only need to look at the critical points. The reverse is not true, though. A critical point can be neither a maximum nor a minimum, which is why every critical point has to be classified.
How to find critical points, step by step
This four-step process finds every critical point of a function of one variable:
- Step 1: Find the domain of f. Note any values excluded by division by zero, square roots of negatives or logarithms of non-positive numbers.
- Step 2: Find f′(x) and simplify it into a single fraction, factored as far as possible.
- Step 3: Solve f′(x) = 0. For a fraction, this means setting the numerator equal to zero.
- Step 4: Find where f′(x) is undefined, usually where its denominator is zero. Keep only the values that are in the domain of f.
Every value from Steps 3 and 4 that lies in the domain of f is a critical point. To report the point on the graph, also compute f(c), so the critical point at x = c is the point (c, f(c)).
Step 2 does most of the work. Factoring f′ completely makes Step 3 easy and also tells you the sign of f′ on each interval, which you will need for the first derivative test. If you need a refresher on differentiating, see how to find the derivative of a function.
Tip: Factor f′ completely before solving. The factored form gives you the critical points and the signs for the first derivative test at the same time.
Classifying critical points with the first derivative test
The first derivative test looks at the sign of f′ just to the left and just to the right of a critical point c. Since f′ > 0 means f is increasing and f′ < 0 means f is decreasing, a change of sign tells you the graph turned around:
| Sign of f′ left of c | Sign of f′ right of c | c is a |
|---|---|---|
The easiest way to apply it is a sign chart. Mark every critical point, and every point where f itself is undefined, on a number line. These split the line into intervals. In each interval, pick any test value and substitute it into the factored f′; only the sign matters, not the size. Then read off the pattern of signs around each critical point.
The first derivative test always gives an answer, and it works at points where f′ does not exist, such as corners and cusps. That makes it the more reliable of the two tests.
Classifying critical points with the second derivative test
The second derivative test uses concavity instead of a sign chart. If the graph is concave up (shaped like a cup) at a point with a horizontal tangent, that point must be the bottom of a valley; if it is concave down (shaped like a cap), it must be the top of a hill. For a critical point c with f′(c) = 0:
| Value of f″(c) | Shape of the graph | c is a |
|---|---|---|
To apply it, find f″(x), substitute each critical point and look only at the sign of the result. It is usually faster than a sign chart, especially when there are many critical points or when f′ is hard to factor.
The test has two limits. It only applies where f′(c) = 0, so it cannot classify a corner or cusp where f′ does not exist. And when f″(c) = 0, it says nothing at all: x⁴, −x⁴ and x³ all have f′(0) = f″(0) = 0, yet x = 0 is a minimum, a maximum and neither, respectively.
Note: f″(c) = 0 does not mean “neither”. It only means this test cannot decide, so switch to the first derivative test.
First or second derivative test: which should you use?
| First derivative test | Second derivative test | |
|---|---|---|
A good habit: try the second derivative test first, because it is quick. If f″(c) = 0 or f′(c) does not exist, switch to the first derivative test for that point. The critical points calculator follows exactly this rule.
Critical points on a closed interval (absolute extrema)
The two tests find local maxima and minima. To find the absolute maximum and minimum of a continuous function on a closed interval [a, b], use the closed interval method instead. No classification is needed:
- Step 1: Find the critical points of f that lie inside (a, b).
- Step 2: Evaluate f at each of those critical points and at both endpoints a and b.
- Step 3: The largest value is the absolute maximum, and the smallest is the absolute minimum.
For example, take f(x) = x³ − 3x on [0, 3]. Here f′(x) = 3x² − 3 = 3(x − 1)(x + 1), and only x = 1 lies in the interval. Comparing f(0) = 0, f(1) = −2 and f(3) = 18, the absolute minimum is −2 at x = 1 and the absolute maximum is 18 at the endpoint x = 3. Note that the maximum is at an endpoint, not a critical point.
Tip: On a closed interval, always check the endpoints. The absolute maximum or minimum is often there, not at a critical point.
Common mistakes to avoid
- Forgetting points where f′ is undefined. Always check the denominator of f′ as well as the numerator.
- Including values outside the domain. For f(x) = 1/x, f′ is undefined at 0, but 0 is not in the domain, so it is not a critical point.
- Reading f″(c) = 0 as “neither”. It means the second derivative test failed, not that there is no extremum.
- Dividing both sides of f′(x) = 0 by a factor containing x. In 4x³ − 12x² = 0, dividing by x² loses the critical point x = 0. Factor instead.
- Substituting into f instead of f′ (or f″) when testing signs. The sign chart uses f′; the second derivative test uses f″.
- Reporting only the x-value when the question asks for the point. A critical point on the graph is (c, f(c)).